Pivot Tables are data summarization tools that can collect, summarize and interpret data from one spreadsheet, displaying the results in a separate table. They are exclusive to Microsoft Excel and part of the reason that Windows program became so popular in the first place. One of the most important things to note about Pivot Tables is that they are interactive analyses of data – you can input raw data and Pivot Tables will summarize it for you in minutes, making the feature excellent for business owners of a tax business or any business, for that matter. Pivot Tables have endless possibilities, but below are the top 4 most important uses for business owners.
Sales Summaries
Because they can take large amounts of data and summarize them in a basic, legible form, Pivot Tables are excellent for organizing sales by product, region or even sales rep. Pivot Tables are particularly useful because they can analyze text just as easily as they can analyze numbers. Employee information can be easily summarized and, instead of searching through thousands and thousands of rows of product information, sales figures can be aggregated by product in an instant. Being able to summarize sales so clearly will have numerous benefits, and all it takes is a little knowledge about Pivot Tables!
Time Tracking
What is strategic planning? For business, it is everything. If you need to log different time for multiple employees, clients and projects, look no further than Pivot Table! Pivot Table allows you to record the date, time spent, client name and project (and more). Then, it summarizes the data into your desired format. If you want to see the information by week, Excel provides a WEEKNUM function; if you want to see a traditional time table layout it can do that, too! Every time you add new information to the raw data set, Pivot Table will make the adjustments automatically, so you don’t have to worry about inaccuracies. Now, you will surely remember this free feature before you buy some expensive time tracking software.
Email Sign-ups
Email sign-ups are an underutilized option with Pivot Table. If you want to analyze email sign-ups by date to see which days of the week were most successful, the Pivot Table is the perfect tool. As long as you have the information, you can add any category and organize your Pivot Table depending on your needs. If you want to narrow it down to specific categories, it allows you to do that, too! You can even color-code your email sign ups. Knowing all the ways you can use its feature will make your job of data entry and analysis that much easier.
Monthly Reports
Using the “Group” feature of Excel you can quickly summarize days, months, even weeks of information into one monthly, quarterly or yearly report. You can group information by month only, to see the sum of sales over the past 3 Septembers, or you can group them by month and year, allowing you to see how each individual month did. By dabbling with Pivot Table, you can summarize extensive amounts of information into one simple spreadsheet!
What To Know About Pivot Tables
Excel pivot tables are not a complicated concept. However, there are some must know things that will help you make the most of this great Excel tool. The first thing to know, creating a pivot table only takes about a minute. Secondly, in order to minimize potential problems down the road, it is important to use high quality source data, and organize it in a tabular layout. Finally, the last tip that you absolutely must use in order to create an effective pivot table is to plan before you create. Make sure you create a pivot table plan regarding what you are trying to measure. These tips will help you use Excel pivot tables to the fullest extent of their worth.
Pivot Tables are a free feature of Microsoft Excel that can immediately make your life easier. With more efficient data summary, your business is guaranteed to run more smoothly. By creating data reports with these verification vs validation features, you’ll have access to data reports, sales summaries and time sheets right at your fingertips, without any extra hassle or cost.
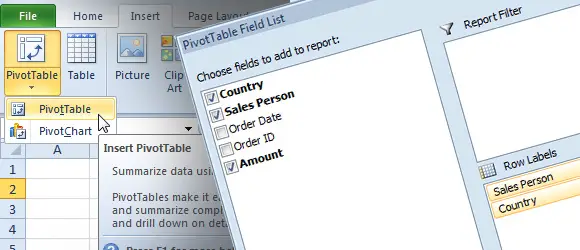
Image from http://www.free-power-point-templates.com/articles/excel-pivot-tables/